
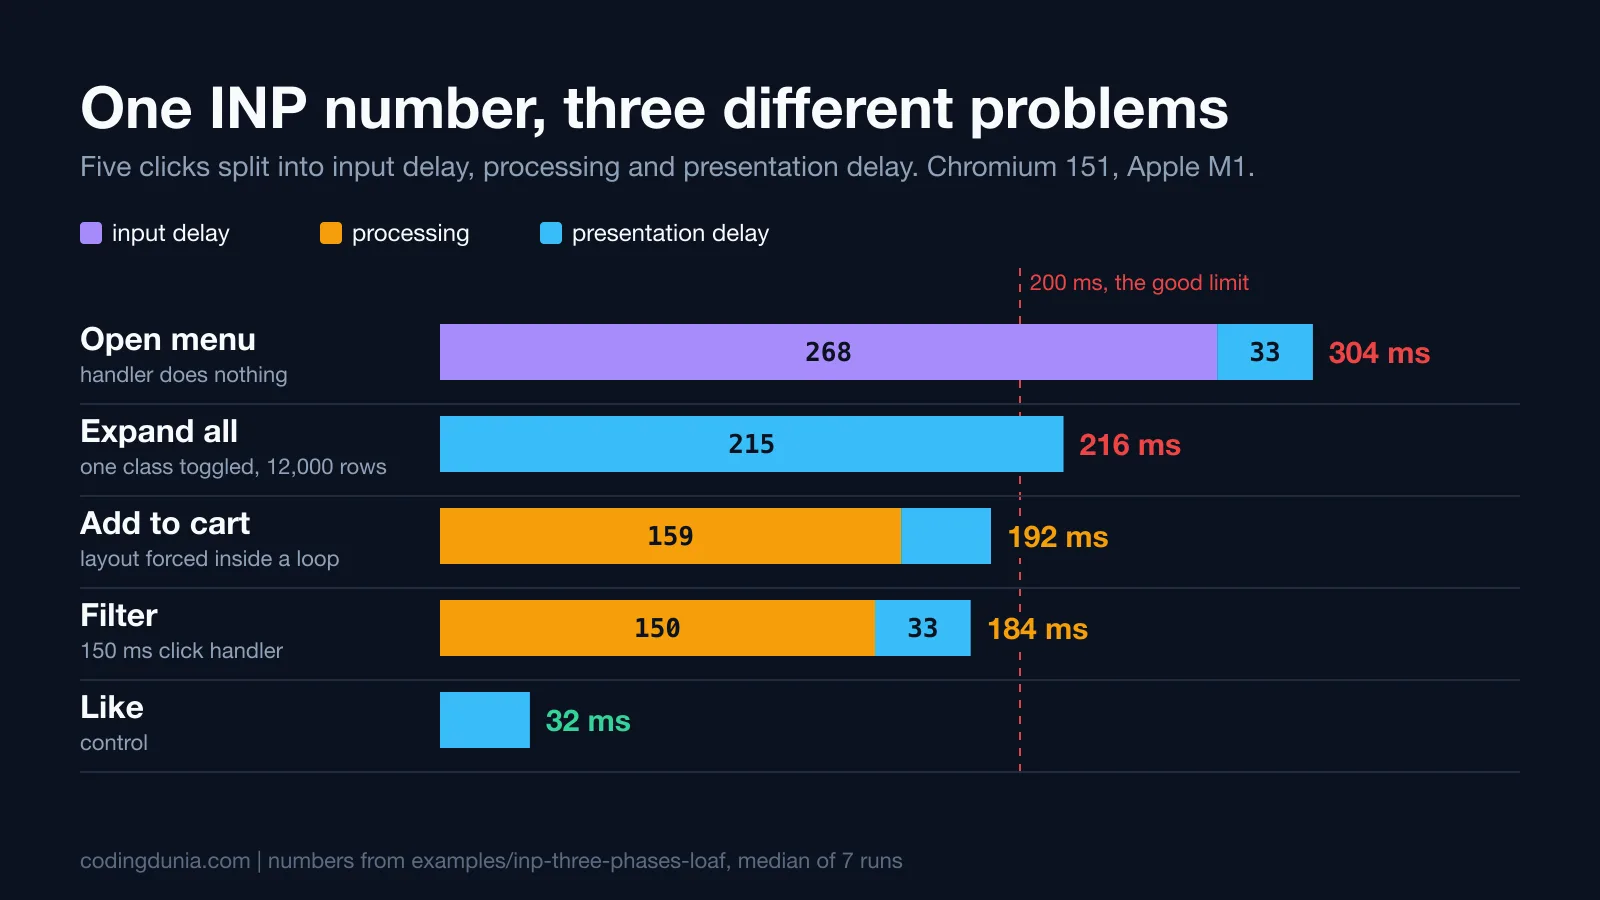
An INP number tells you how bad an interaction was. It doesn't tell you which one, and it doesn't tell you where the time went. That second part matters more than people expect, because the same 200 ms can be a slow click handler, a script that was already running when the user clicked, or a page that takes 200 ms to paint after a one-line change. Each of those has a different fix and a different file to open.
I built a small harness that makes all three happen on purpose, then measured what a 70-line reporter and the web-vitals attribution build say about each. The code is in the inp-three-phases-loaf example, and it asserts every result below. The fix side of the story, how to yield to the main thread, is in the measured yielding guide. This article is about the step before it: knowing what to fix.
What does one INP number hide?
web.dev splits every interaction into three phases, and each phase points at a different suspect, so the first job in INP debugging is to learn which phase is biggest before you open a single file. Input delay is the time from the user's action until the first event handler starts, which makes it a measure of what the main thread was already doing. Processing duration is how long the handlers take to run to completion. Presentation delay is the time from the end of the handlers until the next frame is visible, which covers style, layout and paint:
| Phase | What it measures | Typical cause, per web.dev | Where the culprit script is |
|---|---|---|---|
| Input delay | user action until the first event handler starts | script loading, parsing and compiling, timers, overlapping interactions | not in the click handler |
| Processing duration | all event handlers running to completion | too much work in the callbacks | the click handler |
| Presentation delay | end of the handlers until the next frame is visible | large DOM, expensive style and layout, rendering lots of HTML from JavaScript | often no script at all |
The first three columns summarize the web.dev INP optimization guide. The last column is my own reading of it, and the rest of this article tests it. The same guide rates 200 ms or less as good and above 500 ms as poor, measured at the 75th percentile of page loads, and says the final INP is the longest observed interaction, sometimes ignoring outliers.
Notice what that means. If the worst interaction on your page is an input-delay problem, profiling your click handlers will find nothing, and you'll spend a day proving they're fine. The same goes for presentation delay: a one-line handler can still be followed by a 200 ms paint, and no profile of your own code will show where it went.
How do you split an interaction into its three phases?
With Event Timing. Each event entry carries startTime, processingStart, processingEnd and a duration that ends at the next paint. MDN documents processingStart - startTime as the delay before the handler starts and processingEnd - processingStart as the handler run time. It also says duration is rounded to the nearest 8 ms, and that durationThreshold defaults to 104 ms with a minimum of 16.
One click produces several entries (pointerdown, pointerup, click), and they share an interactionId. So group by that, take the earliest start and the latest end:
new PerformanceObserver((list) => events.push(...list.getEntries())).observe({
  type: 'event',
  durationThreshold: 16, // the minimum; the default would hide anything under 104 ms
  buffered: true,
})

// per interaction, after grouping entries that share an interactionId:
const inputDelay = group.processingStart - group.start
const processing = group.processingEnd - group.processingStart
const presentation = group.end - group.processingEnd // end = startTime + duration
That's the core of reporter.js in the example. Whichever of the three numbers is largest names the phase to chase. It's rounded, so treat differences under 8 ms as noise.
Which script was running while the click waited?
Event Timing says when. It doesn't say who. For that you want Long Animation Frames. The Chrome documentation describes a long animation frame as one where a rendering update is delayed beyond 50 ms, and lists scripts longer than 5 ms in each frame with invoker, invokerType, sourceURL, sourceFunctionName and sourceCharPosition. The invokerType values are user-callback, event-listener, resolve-promise, reject-promise, classic-script and module-script. Support is Chrome and Edge 123 and later, nothing in Firefox or Safari.
Two cautions from the same page. No API links an INP entry to its frames, so you compare timestamps yourself. And the source fields report a script's entry point, not necessarily the slowest line inside it. sourceCharPosition is a character offset into the file, not a line number. My first version printed it after a colon, like a line number, and the file it pointed into has about a hundred lines.
Pairing a phase with a script is then a small rule, and the whole routine fits in four steps:
- Collect every interaction with its three phases, sorted by total time.
- Take the slowest one and name its largest phase.
- Read the overlapping Long Animation Frame scripts with that phase in mind.
- Fix that one script or that one piece of rendering, then measure the same interaction again.
Step 3 is the part that needs code:
const overlapping = frames.filter((f) => f.startTime + f.duration >= g.start && f.startTime <= end)
const scripts = overlapping.flatMap((f) => [...f.scripts])

if (dominant === 'inputDelay') {
  // something that started before the handlers did, and is not a handler
  culprit = longest(scripts.filter((s) => s.startTime < g.processingStart && s.invokerType !== 'event-listener'))
} else if (dominant === 'processing') {
  culprit = longest(scripts.filter((s) => s.invokerType === 'event-listener'))
}
// presentation delay: usually no script to name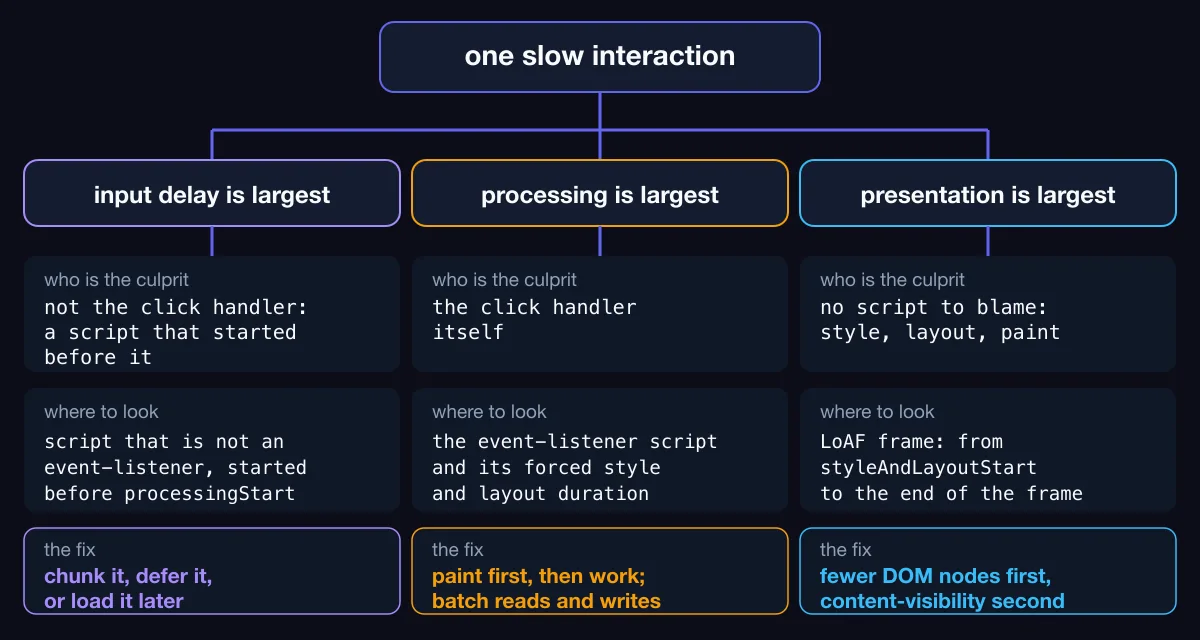
Five clicks, five different bills
The page has five buttons. Playwright 1.62.1 clicks each one with real mouse input in headless Chromium 151.0.7922.34, on an Apple M1 with 16 GB and macOS 26.6.2. Every cell below is the median of seven fresh pages. The handlers use a busy-wait as a stand-in for real work, which I'll come back to.
| Interaction | What is slow | INP-style total | Input delay | Processing | Presentation |
|---|---|---|---|---|---|
| Open menu | handler does nothing, a 320 ms timer job is already running | 304 | 268 | 0 | 33 |
| Expand all | one class toggled, 12,000 rows appear | 216 | 1 | 0 | 215 |
| Add to cart | 1000 style writes, each followed by a layout read | 192 | 0 | 159 | 31 |
| Filter | a 150 ms click handler | 184 | 0 | 150 | 33 |
| Like | nothing, the control | 32 | 0 | 0 | 31 |
Here's what the reporter printed for the culprits, straight from the run:
filter  processing  event-listener BUTTON#filter.onclick -> onFilterClick @ app.js char 938
menu    inputDelay  user-callback TimerHandler:setTimeout -> syncAnalytics @ app.js char 1494
cart    processing  event-listener BUTTON#cart.onclick -> onCartClick @ app.js char 3113
expand  presentation  (no script)
I ran the whole harness three times, and the totals moved by 8 to 16 ms between full runs: the menu came out at 296, 296 and 304. The phases and the culprits never changed. The Like row is worth a look too. Its 31 ms of presentation delay looks like the floor of this headless setup, so a presentation delay in that range isn't something to chase.
Input delay: the handler is innocent
The menu handler flips one hidden attribute. Profile it and you'll see nothing. So where did 268 ms go? It went to a setTimeout callback called syncAnalytics, which was already running when the click arrived, and the LoAF entry names it as a user-callback with the invoker TimerHandler:setTimeout. It isn't in the file you'd open first.
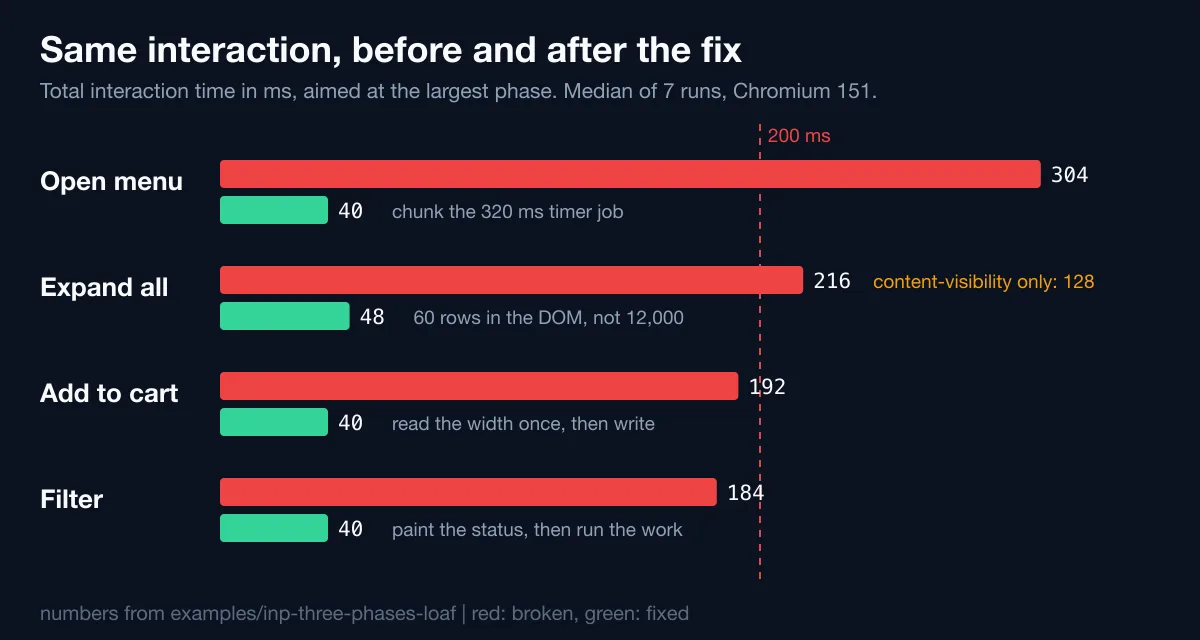
The web-vitals attribution build agrees. Its longestScript summary says syncAnalytics, and labels the subpart input-delay. In real pages the equivalent is an analytics batch, a hydration pass or a third-party tag. The fix lives there. I split the 320 ms job into ten 32 ms chunks with a yield between them, and the click's input delay fell from 268 ms to 12 ms. The mechanics of that yield, and which kind to pick, are what the yielding article measures.
If the thing in the way is a lazy chunk loading at the wrong moment, the same pattern shows up as a classic-script or module-script entry, which makes code-splitting decisions part of an INP investigation too.
Processing: slow code, and slow layout in disguise
The filter button is the textbook case. onFilterClick runs 150 ms, processing is 150 ms, and the LoAF script entry says so with the function's name. My fix is to update the status text, wait for the browser to paint, and only then do the work:
async function onFilterClick() {
  status.textContent = 'Filtering...'
  await nextFrame() // requestAnimationFrame, then setTimeout
  busy(150)
  status.textContent = 'Filtered 150 rows'
}
The measured total fell from 184 ms to 40 ms. I should be straight about what that did, though. The 150 ms of work still happens, it just happens after the paint, so INP stops counting it. A second click during that window still waits. I didn't measure that second click, and in a real app you'd want the work chunked as well.
The cart button is sneakier. Its code looks cheap: a loop that sets row.style.width. But each iteration reads cart.offsetWidth too, so the browser has to recompute layout every time. LoAF reports forcedStyleAndLayoutDuration per script, and for onCartClick it was 156 ms out of 159 ms. That's 98 percent of the handler spent in layout it didn't know it was asking for. Would you have spotted that in a code review? MDN's PerformanceScriptTiming page defines the field as the time a script spent processing forced layout and style.
The fix is reading once, before the loop. Processing went from 159 ms to 1 ms. Without the forced-layout field I'd have called this "a slow loop" and looked for something to memoize.
Presentation delay: nothing to blame but the page
The Expand button toggles one class. The handler takes under 1 ms, no script is reported, and the page needs 215 ms to get the next frame out. web-vitals has nothing to say about a script here either: no longestScript at all. The cost is style, layout and paint for 12,000 rows that were display: none a moment ago.
I tried the fix everybody reaches for first, content-visibility: auto on the rows with a contain-intrinsic-size. The total went from 216 ms to 128 ms. Real, and not enough. Keeping 60 rows in the DOM and a spacer for the rest took it to 48 ms. My opinion: when presentation delay is the problem and the DOM is big, count nodes before you reach for a CSS property. The honest caveat is that my "60 rows plus a spacer" isn't a finished virtual list. It has no scroll handling, so it shows the gain from a smaller DOM and nothing more.
Which of the five would INP report?
I put all five clicks into one page session and compared what my reporter and the web-vitals attribution build said about it, to see whether both tools would name the same interaction as the worst one:
| Rank | Interaction | Total (ms) | Phases (delay + processing + presentation) |
|---|---|---|---|
| 1 | menu | 272 | 269 + 1 + 2 |
| 2 | expand | 224 | 1 + 1 + 223 |
| 3 | cart | 176 | 0 + 161 + 15 |
| 3 | filter | 176 | 0 + 150 + 25 |
| 5 | like | 25 | 1 + 1 + 24 |
web-vitals reported INP of 272 ms, target #menu, longest script syncAnalytics in the input-delay subpart. Both tools picked the same interaction.
The slowest interaction in my five-click session was the one whose click handler did nothing: it waited 269 ms behind a timer job.
That's the result I'd have bet against, and it's why I'd argue against the usual advice to profile your click handlers first. Start from the attribution data, not from the code you suspect. Two of my four slow interactions were really in their handlers. The other two weren't, and one of those was the worst of the lot.
What changes when you collect this from real users?
The same data, in the field, comes from the attribution build. The web-vitals README lists interactionTarget, inputDelay, processingDuration, presentationDelay, loadState and longAnimationFrameEntries. In the 6.2.3 build I ran, the typings also include longestScript, totalScriptDuration, totalStyleAndLayoutDuration and totalPaintDuration. This is a trimmed version of what my harness records:
import { onINP } from 'web-vitals/attribution'

onINP((metric) => {
  const a = metric.attribution
  report({
    value: metric.value,
    target: a.interactionTarget,
    inputDelay: a.inputDelay,
    processing: a.processingDuration,
    presentation: a.presentationDelay,
    loadState: a.loadState,
    script: a.longestScript?.entry.sourceFunctionName,
    subpart: a.longestScript?.subpart,
  })
})
The callback ran in my harness. The report() that ships it to your backend, a navigator.sendBeacon call for instance, I didn't write. Three things I learned the hard way:
- It doesn't answer immediately. My first harness read
web-vitalsright after each click and got nothing. The library waits for an idle callback, up to one second, or for the page to be hidden. I now send avisibilitychangewith the state forced tohidden, which is what a user leaving the tab does. - The default threshold is 40 ms. The README says events faster than
durationThresholdaren't reported. I lowered it to 16 to see the control click. In production the default is fine. reportAllChangesis for debugging. The README says it's not recommended in production, so don't ship it just because it made your test pass.
Beyond that, how you aggregate matters more than how you collect. Group by interactionTarget and by which phase is largest, and sort by 75th-percentile INP rather than by count. One button that's awful for a few users and another that's mildly slow for everybody can rank either way, and only the grouped numbers will tell you which. The field guide on web.dev lists INP support in Chrome and Edge 96, Firefox 144 and Safari 26.2, so the phase fields should arrive from all three engines, while script names come only from Chromium. I tested Chromium only.
In React, startTransition helps by letting a click interrupt a long render: in the yielding article a click waited 203 ms behind a plain setState and 5 ms behind a transition. I wouldn't expect it to shrink presentation delay, but I haven't measured that. The React Profiler only sees React's own render and commit work, so it can't split an interaction into these phases either. For the wider field-and-lab setup, the Core Web Vitals guide covers LCP and CLS alongside INP.
What this doesn't prove
One machine, one headless browser and handlers made of busy-waits limit what these numbers prove, and the busy-waits are clean on purpose: real code allocates, touches the DOM and calls five libraries. LoAF drops scripts under 5 ms, so a handler that dies from a thousand small cuts will show up as unattributed time, and my harness has no such case. I used mouse clicks only, no keyboard, no touch, and no iframes (the Chrome docs say cross-origin iframes are excluded from script attribution). I ran no Firefox or Safari.
reporter.js also does less than the library. It groups by interactionId only, while the library groups events by the frame they were presented in. A comment in the web-vitals source describes one case that matters there, a long pointerover handler still running when the click arrives, and the library clamps the input delay so it can't go negative. I didn't test that case. For anything you ship, use the library and keep my 70 lines for the console.
Which of your own slowest interactions would still be your slowest if you sorted them by phase instead of by handler? The next time INP goes red, I'd ask that question before opening a single component. If the answer is "the part where the browser had to paint", the ViewTransition measurements show what a transition changes in that step, and the event loop explainer covers the ordering rules underneath all three phases.